
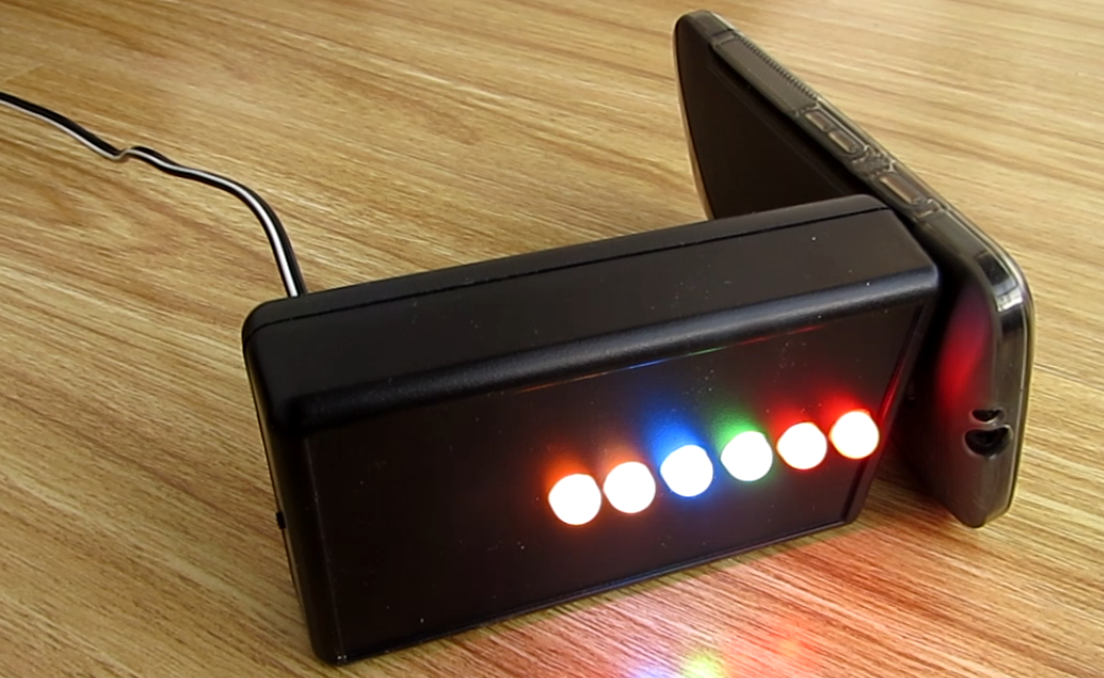
Music Beats Visualizer is an Arduino controlled spectrum analyzer, which lets you visualize sounds according to their frequency. The input is an electret microphone, and the output is 6x WS2801 RGB LEDs. The lights change colour depending on the amplitude of the input to the microphone (silent = blue, loud = red), but only the LED corresponding to a particular band of frequencies changes. So someone singing at a high frequency would alter the top most LED, and a low note from a bass guitar or drum would affect the bottom most one. Some people call these graphic equalizers, although that’s technically the opposite way round (controls used to change the output of the sound).
For this project I used the battery and charging circuit from an broken electric hair clipper, with a 2.4v output, and connected this to a voltage converter to output 5v to the Arduino. This means it can be plugged into to recharge, and use the 2xAA cells which are small enough to fit into the box. But you could just power it from a 5v supply.
The Circuit
The Fritzing diagram below shows how to connect the Arduino to the microphone and strip of WS2801 pixels. Once the +5v and GND have been connected for all the components, the only other connections are: electrec mic output to Arduino A0; WS2801 data pin to Arduino D13; WS2801 clock pin to Arduino D11.


Components:
Arduino Nano v3
Adafruit electret mic
Strip of 6 WS2801 RGB LED pixels
Jumper wires
ABS plastic box
Sugru (to hold some of the components in place
5v voltage converter circuit
2.4v battery and charging circuit
The Arduino code
The code (download here) comprises of two main parts (you’ll need to download these libraries and place them in your arduino folder):
a) The Adafruit_WS2801 library which allows us to simply control the WS2801 pixels. (we can’t use the FastLED library for this project, since it interferes with the FHT library)
b) The FHT library, allowing us to split up the frequencies and deal with them individually. Much of the code is based on the FHT example. This is library allows the Arduino to perform Fourier transforms, which converts a signal from the time domain into the frequency domain. See the picture below, for a graphical representation. I remember doing Fourier transforms by hand during a maths class and University, which was painfully slow and boring, but the process is very useful for most kinds of signal processing, from sound editing on your computer to real time active suspension systems on cars. This project demonstrates its use very simply!
You can download the code , which is fully commented, but basically it does the following:
A direct analogue input is taken from the Arduino’s A0 pin. The sample is a short time period, over which the FHT is processed. The output of this is a frequency spectrum, showing which frequencies have a high amplitude.
Next, the frequencies are grouped together into 8 “bins”, since we don’t want to view each individual frequency as we only have 6 LEDs (and most of the high frequencies are inaudible anyway, so we don’t need to visualize these. The first 2 bins of data are not relevant, so we are left with 6.
The next step is to remove the noise. When the input is silent, the signal output still shows changes, so this is electronic “noise” in the circuit and software itself. The noise was found by basically subtracting the value of a pink noise spectrum, and then tweaked by trial and error.
The final step is to map the output value of each frequency bin to a value which corresponds to a colour, which is then directly written to the WS2801 pixels.
And all that happens multiple times a second!
Check out these other examples doing a similar thing:
http://www.gregington.com/2013/10/disco-skirt.html
http://mcclanahoochie.com/blog/portfolio/music-visualization-with-an-arduino/