
Weather Monitoring – Part 1 – with ThingSpeak and Slack
Part 2 – This post
Why measure air quality?
For the second part of my Raspberry Pi weather monitor, I wanted to add an air quality sensor. Air quality is big news, not just in places like China and India but also in the UK, and it not only is a contributor to global climate change but is also harmful to human health. If God made the world and we have a responsibility to look after it, I think at least one way of advocating for change is by raising awareness through accurately measuring the problem.
I chose to look at PM2.5, which is the measure of particulate matter that is less than 2.5 microns across. Particles of this size are the most damaging to health. Furthermore, this is one measure used in calculating the Air Quality Index, which means I can compare my results with those reported on other websites.
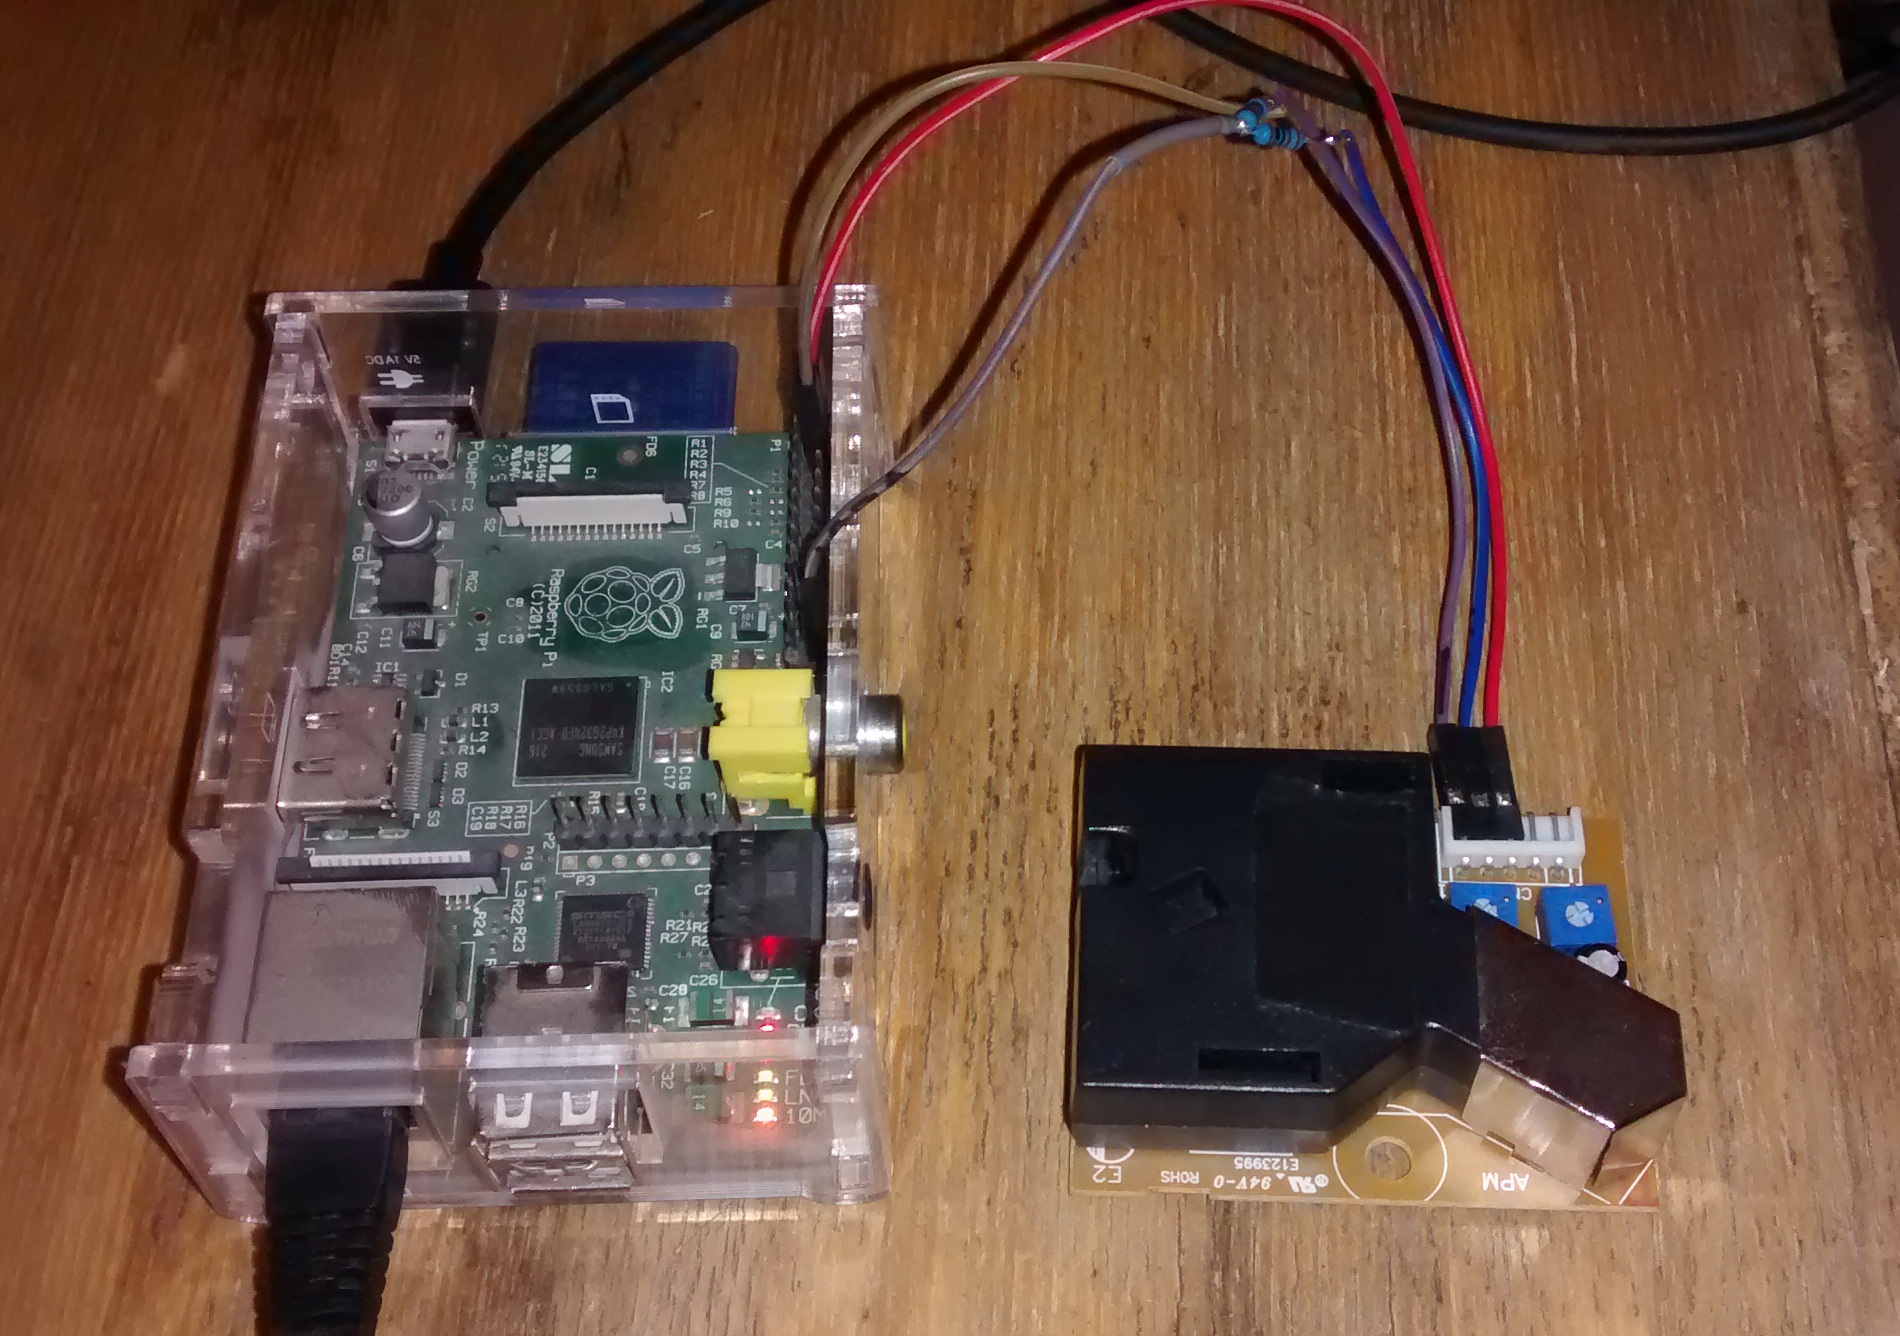
Hardware
I came across the Shinyei PPD42NS sensor (the Grove Dust Sensor has one at its heart) on the Air Quality Index Project website (http://aqicn.org/sensor/shinyei/), which gives a favorable comparison with some professional equipment when measuring PM2.5, plus its only a few quid.
As with many electronics sensors, the PPD42NS works on 5v. The Pi can provide 5v power, but the logic pins are 3.3v, and so to connect it to the Raspberry Pi we need to make a voltage divider to step the output pin voltage down to 3.3v.
Software “drivers” for the sensor
Software wise looked initially more difficult. There is more software written for the arduino than the Pi I think the reason for this is that the process you are using requires real time access to the sensor output. According to the specification sheet, in order to determine the concentration in the air of particles over 1 micron in size, you measure how long the digital output signal is low during the 30 second sample time. This ratio is used to read of a graph on the specification sheet to calculate the concentration in the air particles less than 1 micron in size. With an arduino, there is no issue with measuring the time that the signal is low for, however, the Raspberry Pi generally does not have real time access to GPIO pins in the same way, so you can’t just use the python RPi.GPIO or gpiozero packages. However, I found that the pigpio package I used for interacting with the humidity sensors in part 1 of this article also has a example of how to access this sensor, so in the end the software to access the sensor data was not too tricky. Pigpio basically accesses the GPIO at a very low level and so can a near-real time reading of the pins (as far as I understand.). The pigpio example also has a formula for converting from the ratio of low:high signals on the output pin to the concentration of particles per 0.01 cubic feet. The formula was derived by fitting a curve to the graph on the specification sheet – I think originally calculated by this guy).
Converting the measured value to something more useful
Step 1: From concentration in an imperial volume to weight in a metric volume
“Concentration of particles less than 1 micron in size per 0.01 cubic feet” is ridiculously long for a unit, and makes no sense to me whatsoever. Fortunately there is the AQI (Air Quality Index – devised by the US Environmental Protection Agency) which is a much more meaningful unit, and we can also compare our data against publicly available readings. However, the AQI is based on the input of micro grams of particle per metre cubed (µg/m3), so first we need to convert concentration of particles less than 1 micron in size per 0.01 cubic feet into this unit. That’s the pcs_to_ugm3 function in my code. This is an approximation, for the following reasons:
– We assume all particles are spherical with a particular density, which may not always be the case
– We assume all particles have a radius of 0.44µm in the PM2.5 range. This may vary.
– We assume the air is perfectly dry – in fact humidity and rain can be absorbed by particles in the air and cause an increase in density.
This approximation was derived and documented by a group of students at Drexel University doing Air Quality monitoring – I found the report online – see page 12 for details. They actually implemented a correction factor for humidity and rain, which I should be able to incorporate later since I am measuring the humidity too.
Step 2: Air Quality Index calculation
The Wikipedia AQI page shows the formula used for calculating the AQI from the concentration value in µg/m3. I’ve written this calculation in the ugm3_to_aqi function.
There are various different AQI’s, but all fairly similar to the US one. The UK index only really measures the lower half of the scale, since UK air quality is generally good, so in many parts of the world measuring on this scale would be 10 (worst) all the time. The AQI can be measured for various different pollutants, and is generally taken to be the highest value. So we can only say this is the AQI for PM2.5 as we are not measuring other pollutants like SO2 or NO2.
Installation (air quality sensor only)
See the weather-monitor github page for complete installation instructions – air_quality.py works as a standalone script which just prints the output to the screen.
Weather monitor implementation
I found that several times the conc/particles/0.01ft^3 was 1114000.62 – which is way above normal, and perhaps is the max output of the sensor, so I’ve set the code just to scrap these readings as I’m am pretty sure they are erroneous. I’m not sure whether the few zero readings I am getting are valid or not.
I haven’t yet integrated this for upload to thingspeak and slack – this will require some additional calculation, since AQI for PM2.5 should actually be given as a 24 hour average of the PM2.5 concentrations in µg/m3 – the instantaneous answer from one reading is not the correct way to calculate the AQI.