
As I’m expanding my online sales through eBay, I’ve found its quite difficult to actually find basic statistics of the monthly sales by item.
This is quite important if you sell the same product over and over again, as I need a view on how many are sold so I can order the right amount of stock for the coming months.
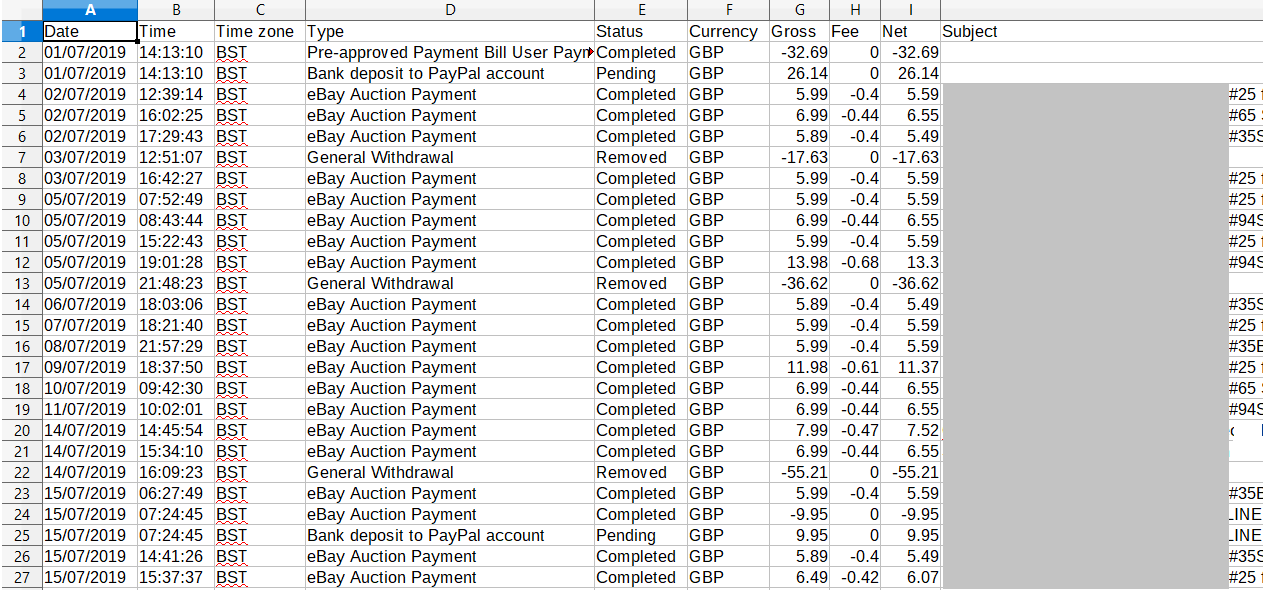
You can download your PayPal account transactions, but this shows every single line and sale, what I want is a summary of how many of each item was sold, not a list of all sales!
Python and Pandas to the rescue! I made a short script to process the PayPal sales record and give me a summary. Here’s how:
The first step is to login to your PayPal account, Reports > Activity Download, then choose whatever time period you are interested in, and click create report. I did this for multiple times and downloaded about 8 months worth of the record, creating a seperate file for each month, and choosing the month for the filename.
Next we can create a python venv and install pandas, and create a python file:
python3 -m venv env
source env/bin/activate
pip install pandas
touch ebay-stats.py
Now we can edit our ‘ebay sales report by quantity.py’ file. Here’s a basic outline of what I want to achieve:
- Choose only the rows in PayPal that are a sale, such as purchases and bank transfers etc. (line 7-9)
- Group the sales based on the name of the item that was sold, and add an additional column giving the sum. (line 14)
- Remove all other columns (line 10)
- Do 1-3 for multiple months / files and plug these all into one dataframe. (line 6, 24-27)
- Get the mean quantity of items sold per month, averaged over the period of sales provided. (line 36)
- Get total quantity of items sold for each month and on average. (line 37)
- Export the data back to a CSV file. (line 39)
Here’s the Python code:
Obviously it was a little more complex than 7 lines of code, so here are some of the issues I came up against and how I solved them.
Issue A) – I changed the Item Name in eBay at various points, so these were not grouped together.
Solution A) – I looked into matching and summing based on a pattern matcher or the python fuzzywuzzy module. In the end it was not worth the effort for 5 or 6 items. I simply renamed the old name I used with the new one before I did any processing. (line 14)
Issue B) – The column names Subject, sum and count were not very clear and would be duplicated for each month in the dataframe
Solution B) – I simply renamed the index for the item name, line 15, and then chose a column name based on the filename which had the month label, e.g. 08-2019 for August, lines 18-21.
Issue C) – When the data from various months was merged together, there were some months which didn’t have any sales, and so the value given was NaN. You can really do a mean calculation on this.
Solution C) – I replaced these values with the actual quantity, aka ‘0’, line 29, however this actually ended up as type float, 0.0, so I also needed to convert this to type int, line 34.
Issue D) – I had some personal / one off items not relevant.
Solution D) – Drop these rows manually, line 31.
So that’s how the code works – I ended up going from 8 pages of this:
to this:

The next step is to summarised the Sales value in £ the same way, and also calculate the profit – that will have to wait for the next post!
Leave a Reply